%BLOG-6-NETWORK
What Nine Packet Captures Taught Me About Networks I Thought I Already Understood
I have spent the last several months studying for the CCNA, which means I have answered a lot of multiple-choice questions about TCP's three-way handshake, about DNS record types, about ARP resolution. I could recite the sequence of a TCP handshake before I ever watched one happen. That gap, between being able to answer a question about a protocol and being able to point at real bytes on a real wire and explain why they look the way they do, is what this project was built to close.
The project is called Wireshark Network Analysis, and the short version is: nine scenarios, each one a real, reproducible network condition I caused on purpose and then captured, read, and explained using Wireshark, the open-source packet analyzer that does the actual reading. DNS lookups and a truncated response. A TCP handshake and a connection refusal. HTTP and HTTPS side by side. A working ping and a filtered one. Real packet loss and the retransmissions that follow it. ARP resolution and a real DHCP lease negotiation, both from a two-VM home lab. Telnet against SSH. FTP against its encrypted alternatives. None of it is exotic. All of it is the kind of traffic an IT support technician, a network engineer, or a SOC analyst runs into during an ordinary week, which was exactly the point.
Why I built this instead of just reading about it
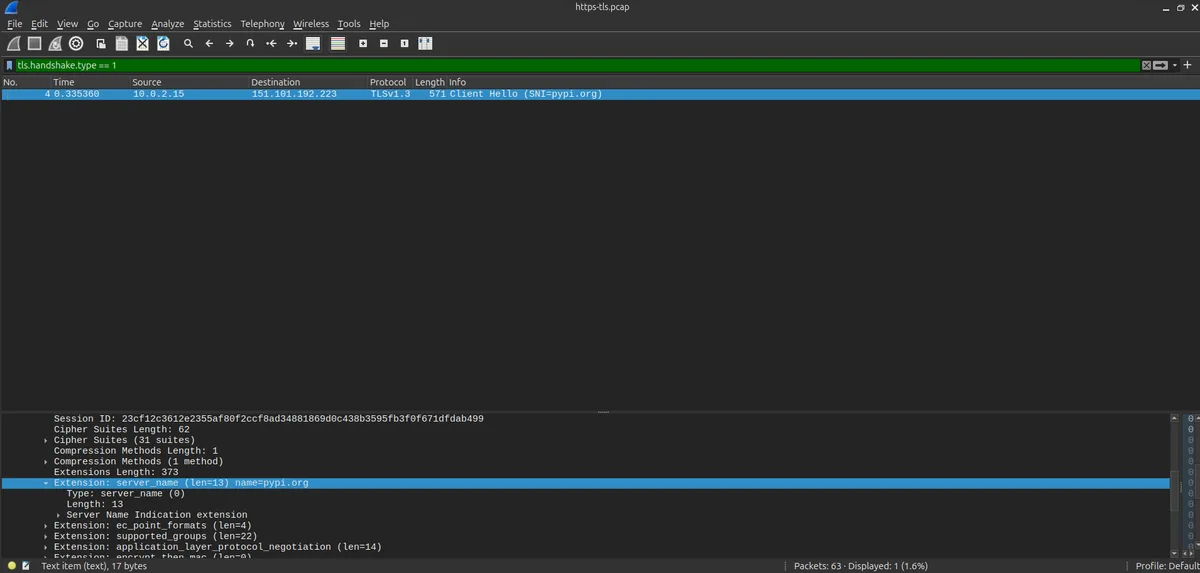
There is a specific kind of knowledge that only survives contact with a real capture. You can read a hundred explanations of why TLS's Client Hello leaks the domain name you're connecting to, and it will sound like a minor technical footnote right up until you open the packet detail pane yourself, expand the Client Hello, and see the plaintext hostname sitting there in a session you assumed was fully encrypted. The footnote becomes a fact you have personally verified, and facts you have personally verified are the ones you can actually defend under a follow-up question, in an interview or on a real ticket.
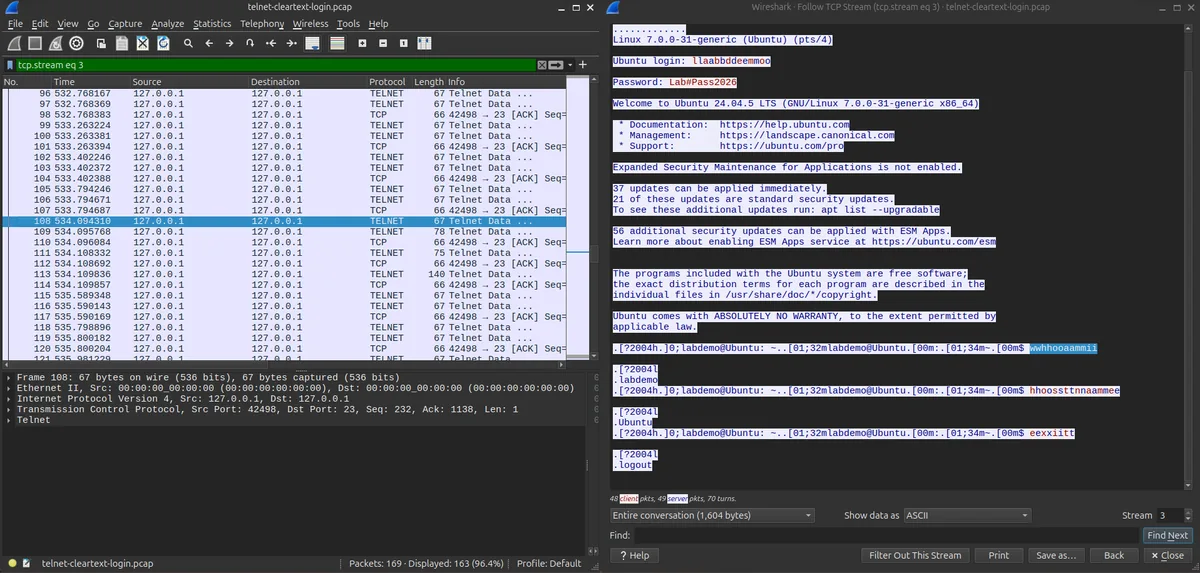
That distinction matters more than it sounds like it should. Anyone can memorize that Telnet sends credentials in the clear. Far fewer people have actually watched a login prompt, username, and password scroll past in a Follow TCP Stream window, in their own capture, on their own machine. The first is a fact you were told. The second is a fact you own.
So the rule I set for myself building this project was simple: every capture had to be something I actually generated, not a canned example downloaded from somewhere, and every screenshot had to come from my own Wireshark window, not a stock image or an automated render. If a scenario needed a specific, messy outcome, a truncated response, packet loss, a refused connection, it had to be produced by actually causing that condition and capturing the real, sometimes inconvenient result, rather than editing a cleaner-looking pcap after the fact. That same rule is also why three scenarios I originally scoped for this project, VLAN trunking, OSPF, and Spanning Tree, aren't in the final nine at all. Producing genuine traffic for any of them needs simulated or real switch/router infrastructure (GNS3 or Packet Tracer) beyond what this particular lab build covers, and I'd rather cut a scenario outright than fill the gap with a guessed-at write-up dressed up as a real capture. They're a clean follow-up project once that infrastructure exists, not a corner I quietly cut.
What each scenario is actually teaching
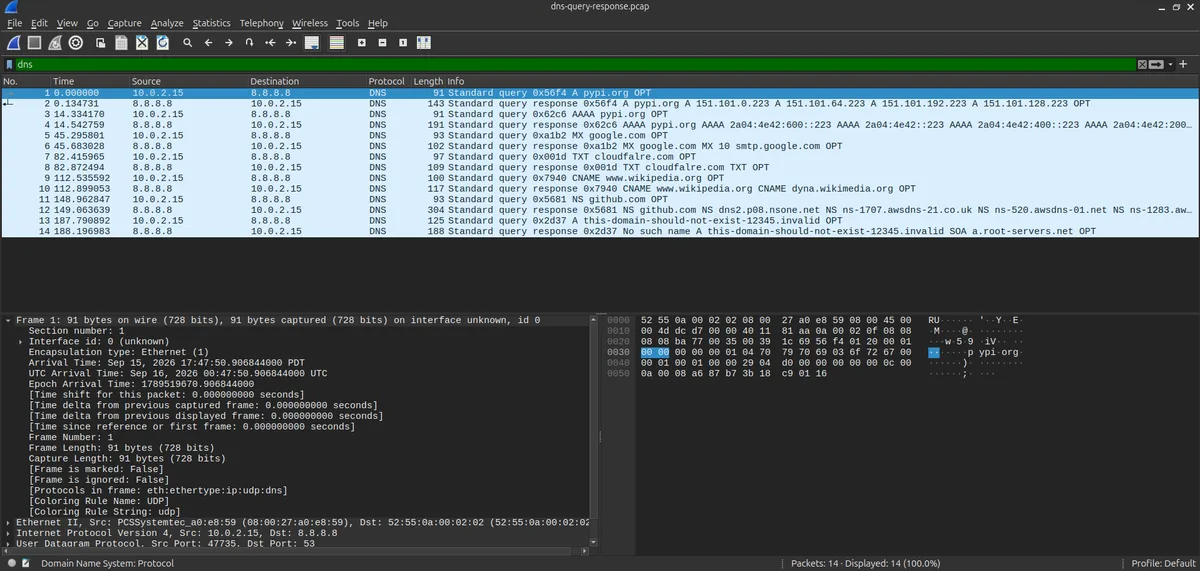
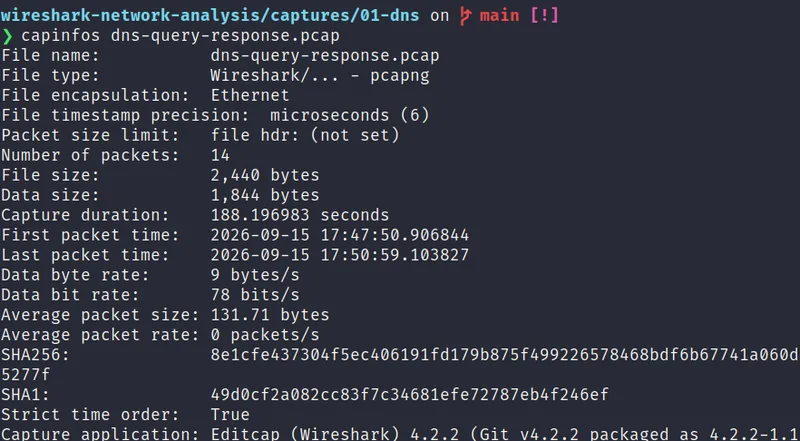
DNS, seven ways. A single "here's a DNS query" capture doesn't teach much, so this scenario runs seven different lookups against a public resolver: an A record, an AAAA record, an MX record, a TXT record, a CNAME, an NS record, and one lookup against a domain that doesn't exist. The interesting one is the TXT lookup, which comes back truncated because the answer doesn't fit in a single UDP packet. Watching that happen taught me something I hadn't fully internalized from studying alone: firewall rules written only for "DNS is UDP port 53" silently break the retry, which needs TCP port 53, and that's a genuinely common, easy-to-miss gap in real network policy.
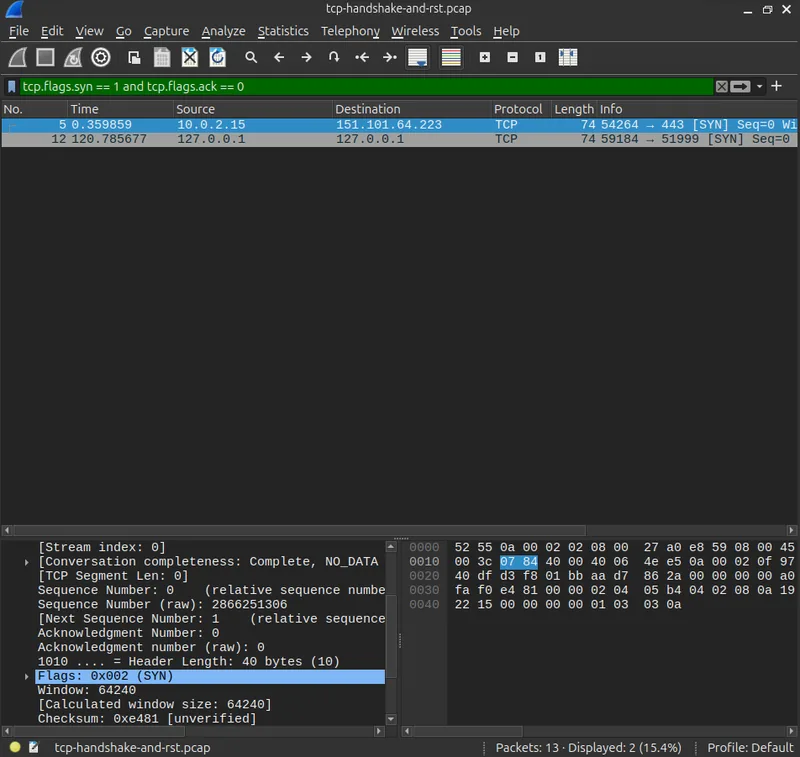
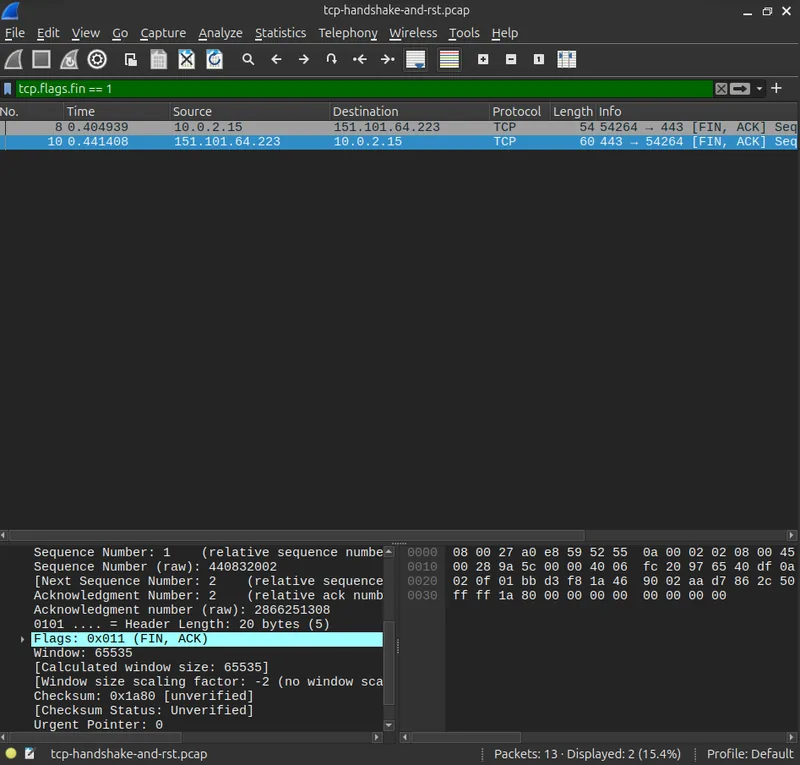
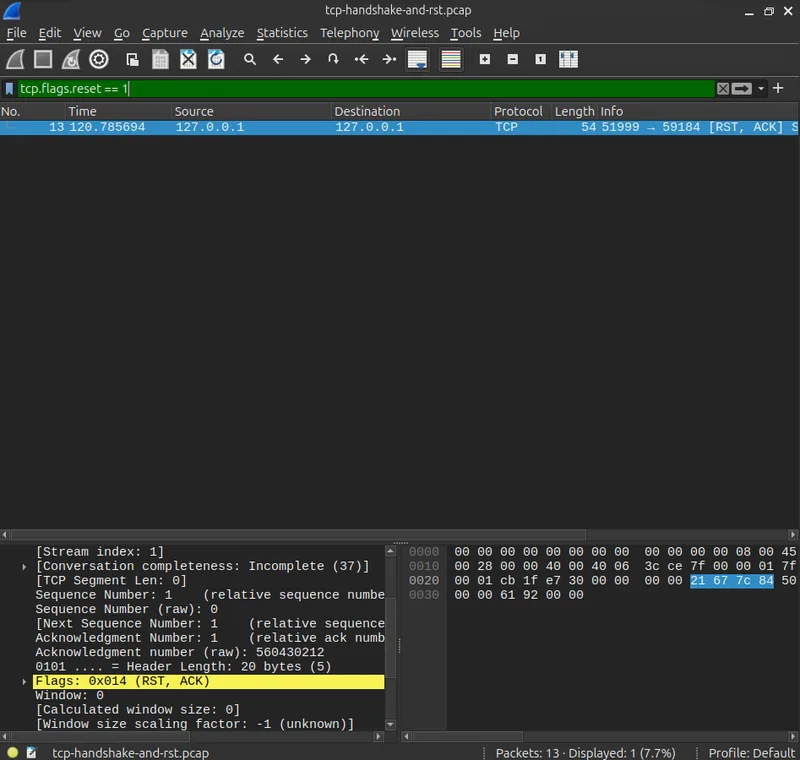
A handshake, a graceful close, and a refusal. Three packets for a SYN, SYN-ACK, ACK sequence is easy to memorize. What's less obvious until you've seen it is the difference between a closed port (which answers immediately with a reset) and a filtered one (which answers with nothing at all and just times out). That distinction is the entire logic behind how a port scanner classifies a target, and it's also the first thing worth checking when a connection "doesn't work": did it get refused, or did it just vanish.
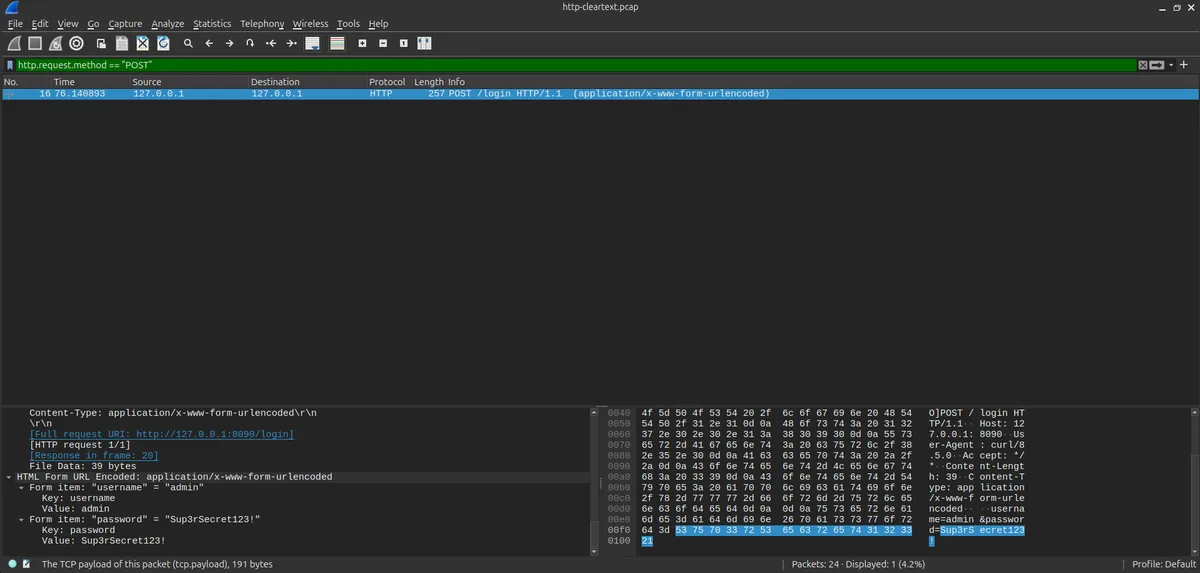
HTTP against HTTPS, side by side. I built a tiny local web server with a fake login form specifically so I could submit a username and password over plain HTTP and then read them back, in full, from the packet capture. No cracking, no decryption, just Follow TCP Stream and there they are. Then I made the same kind of request over real HTTPS to a public site and tried the same thing: nothing readable at all, just encrypted binary, except for one detail that surprised me the first time I saw it. The Client Hello, the very first message of the TLS handshake, contains the plaintext hostname you're connecting to, because the server needs to know which certificate to present before any encryption exists. TLS hides what you send. It does not, by default, hide who you're talking to.
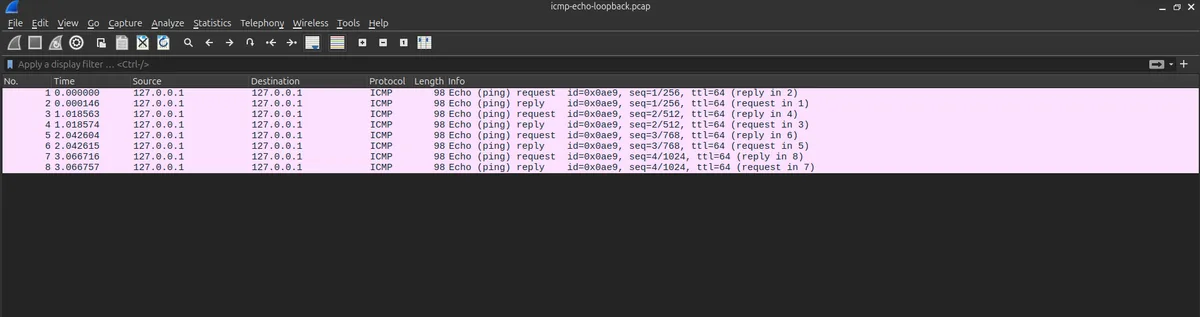
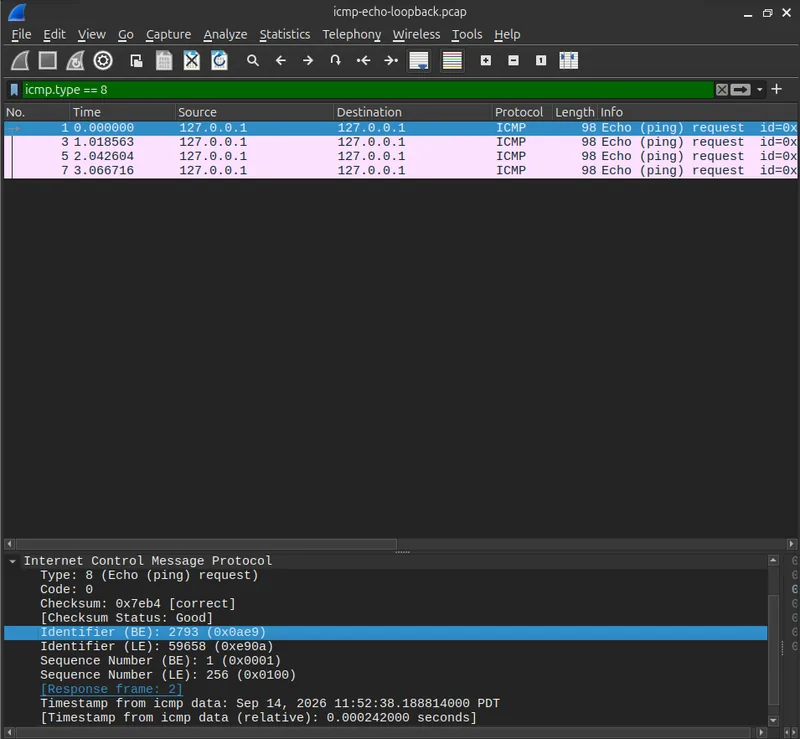
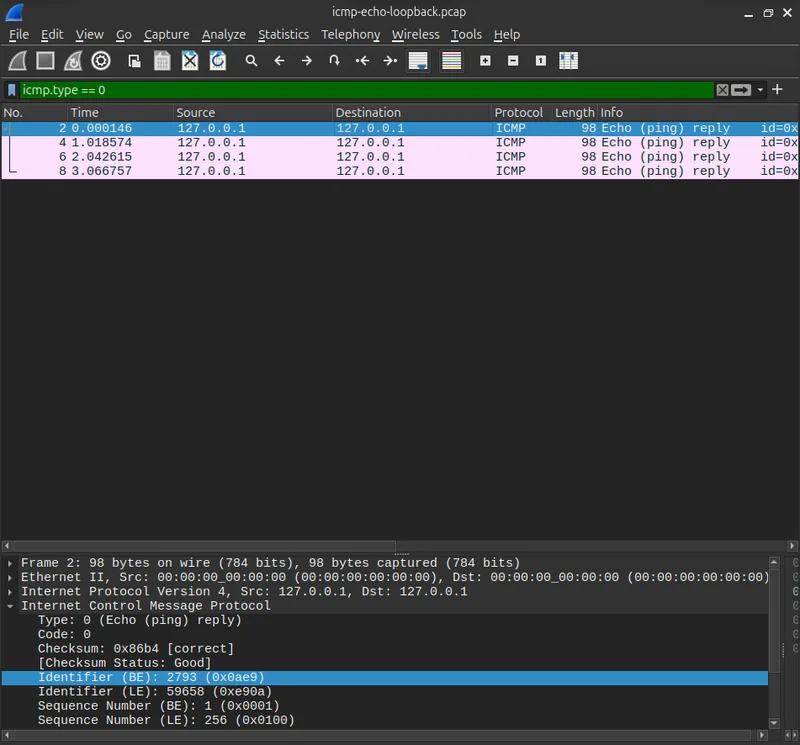
Ping failing does not mean the network is down. I tried to ping a real public DNS resolver from my build environment and got a hundred percent packet loss, four requests out, nothing back, not even an ICMP error telling me the request was rejected. My first instinct was that something was broken. It wasn't. DNS lookups and HTTPS requests from the exact same environment worked perfectly. What I was actually looking at was a network policy filtering ICMP specifically while allowing the traffic that actually mattered, which is extremely common in locked-down environments and is a completely different problem than "the network is down." Recognizing that pattern, rather than escalating a false alarm, is a real, day-to-day troubleshooting skill, and now I have a packet capture that proves I understand it instead of just being able to state it.
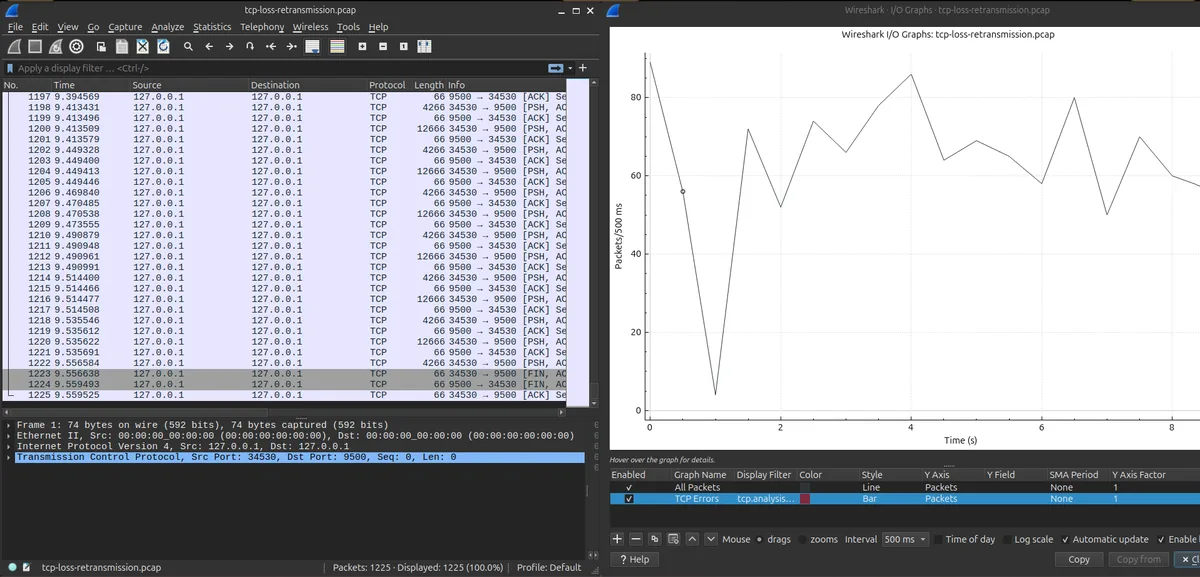
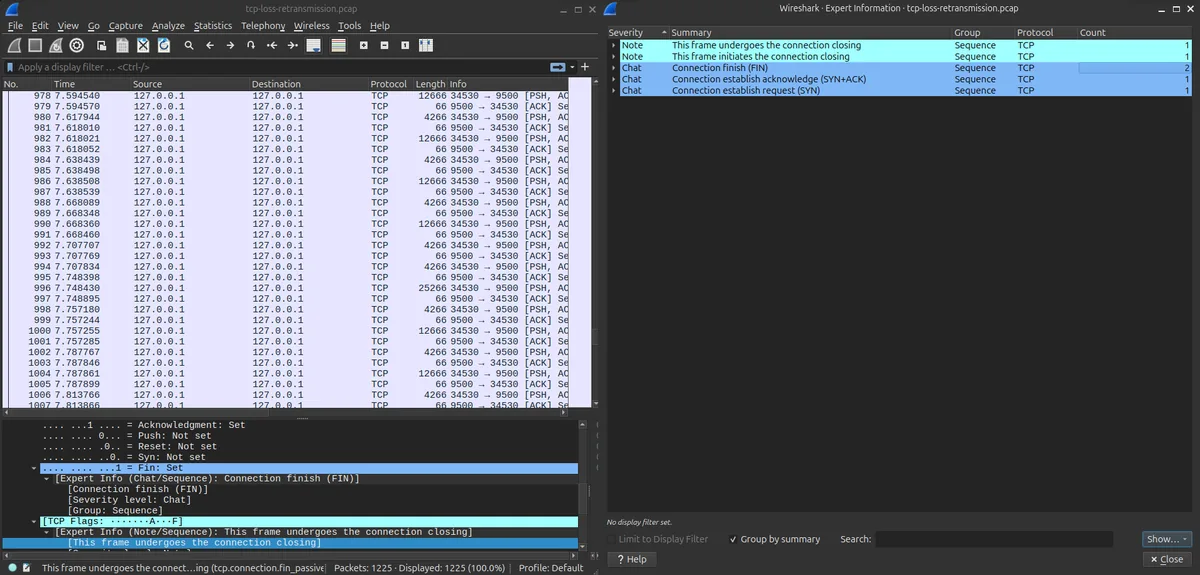
Packet loss you can watch happen. This is the scenario I'm proudest of. I added a firewall rule that randomly drops fifteen percent of the packets headed to a test server, then ran a real five-megabyte transfer through it and captured the whole thing. Opening the result in Wireshark's I/O Graph, instead of a smooth line, you see a stair-step: throughput collapses to almost nothing for a stretch, then spikes well above normal as everything that was stuck finally gets through, then repeats. That shape, a flat stretch followed by an oversized recovery burst, is the single most recognizable signature of loss-induced retransmission, and it's exactly the kind of pattern that turns "the connection feels randomly slow" from a vague complaint into something you can point at and explain. I traced one specific retransmission down to the exact frame and watched the retry timer roughly double between attempts, which is TCP's exponential backoff happening for real, not as a diagram in a textbook.
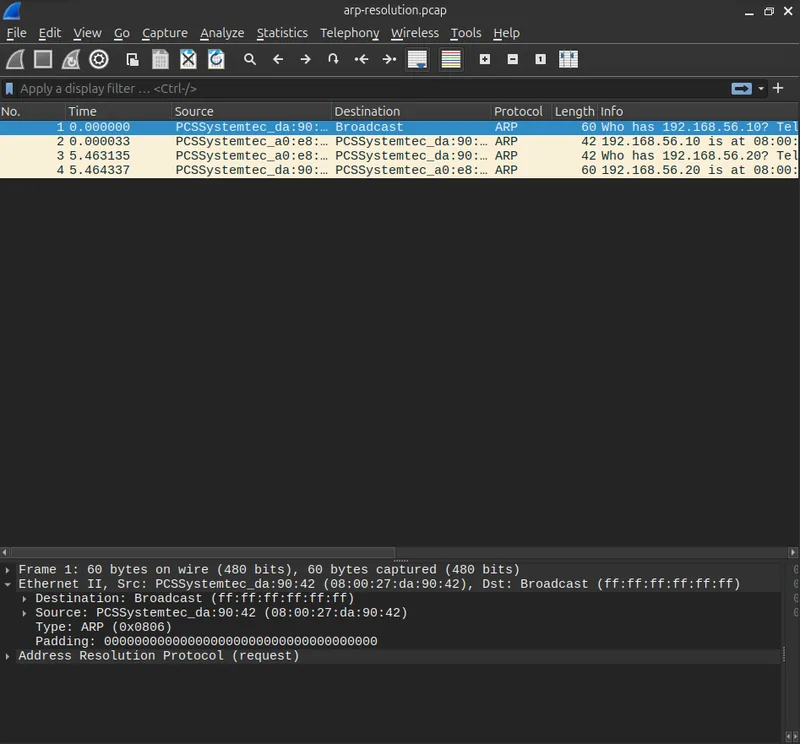
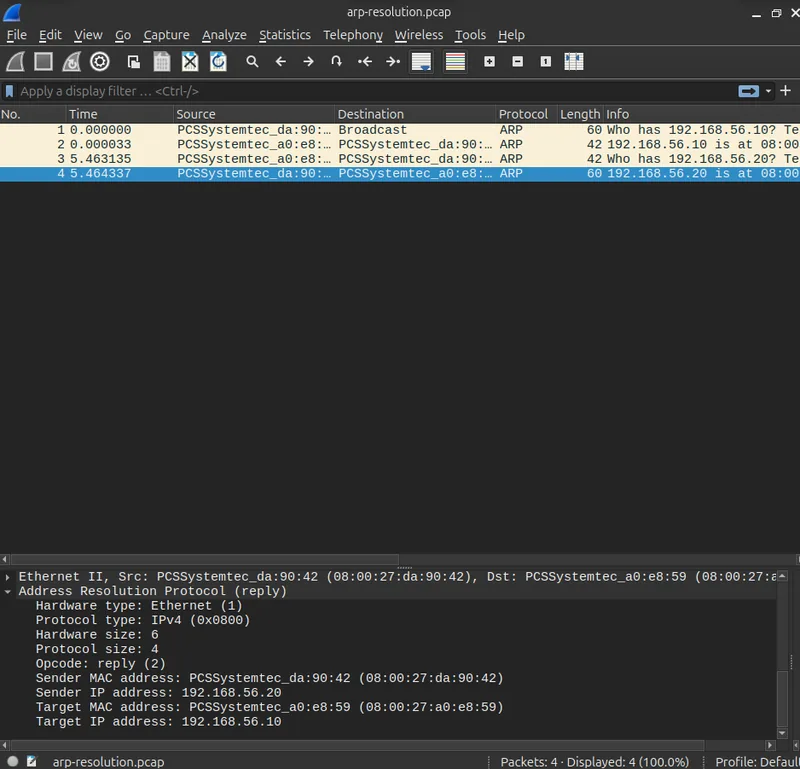
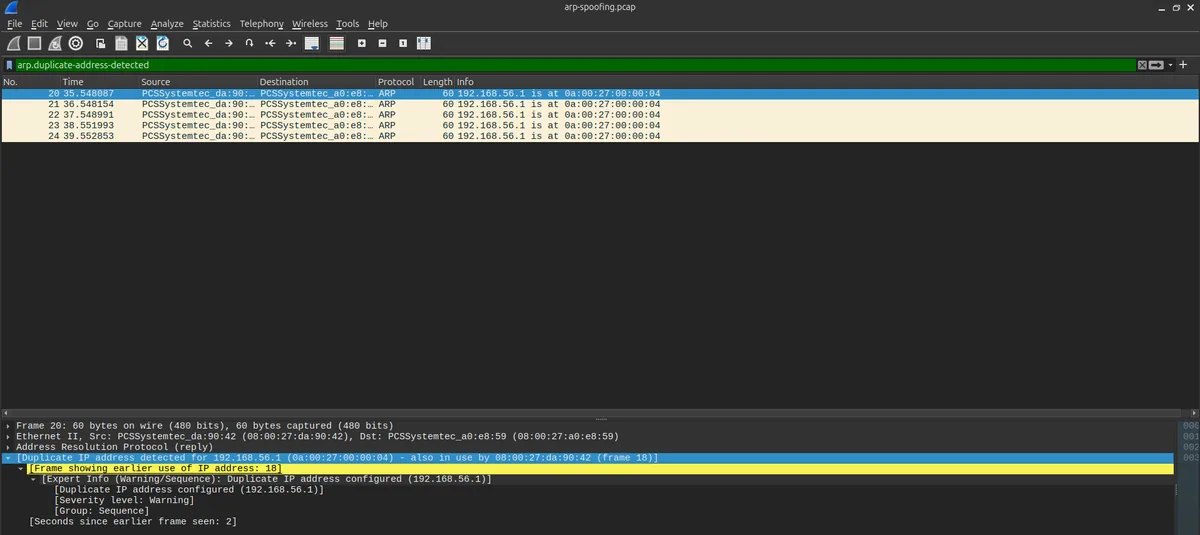
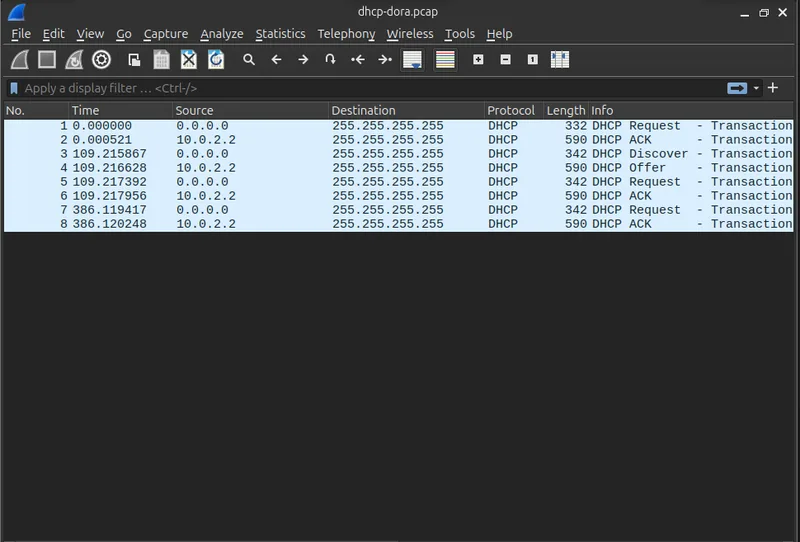
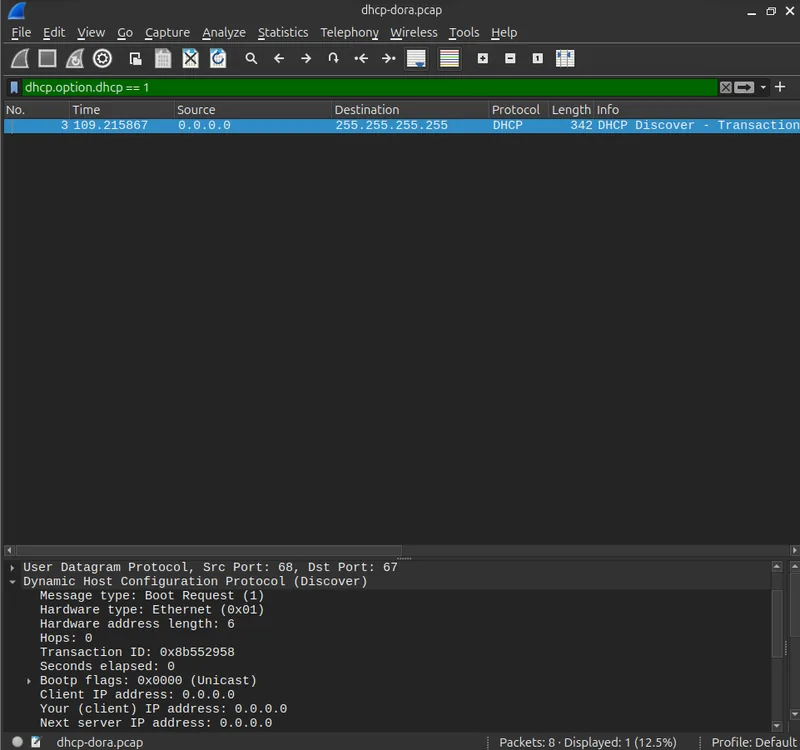
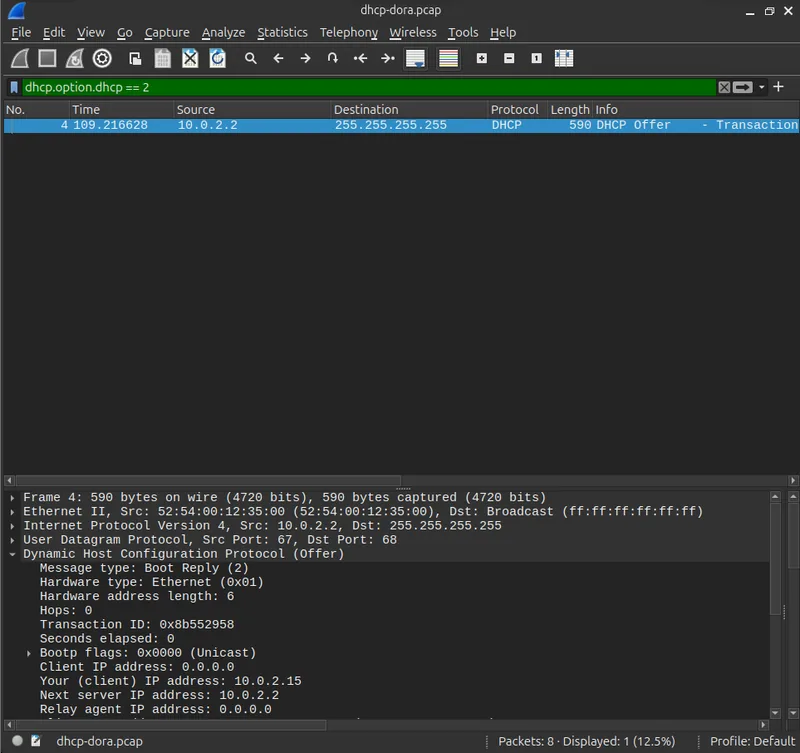
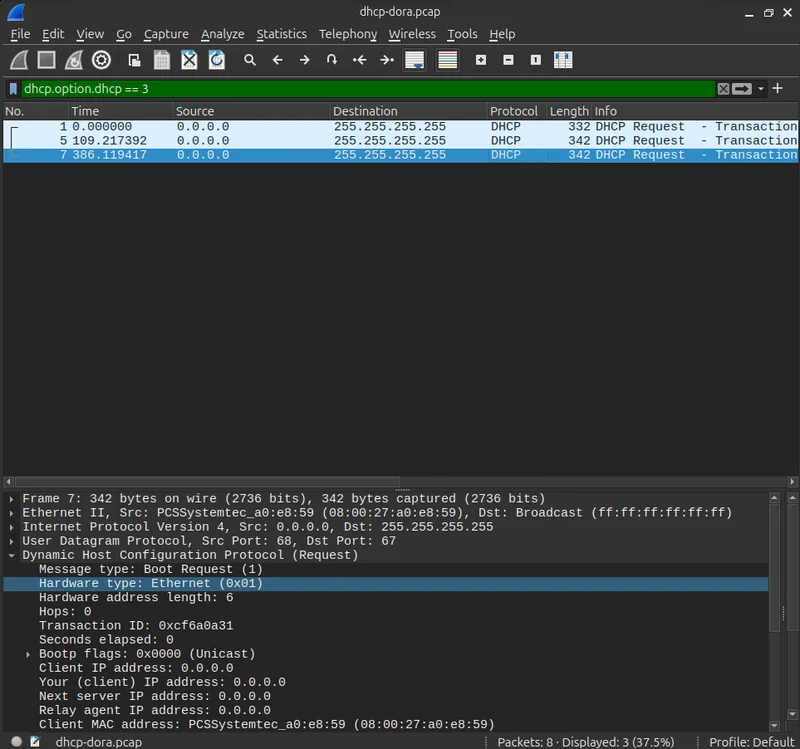
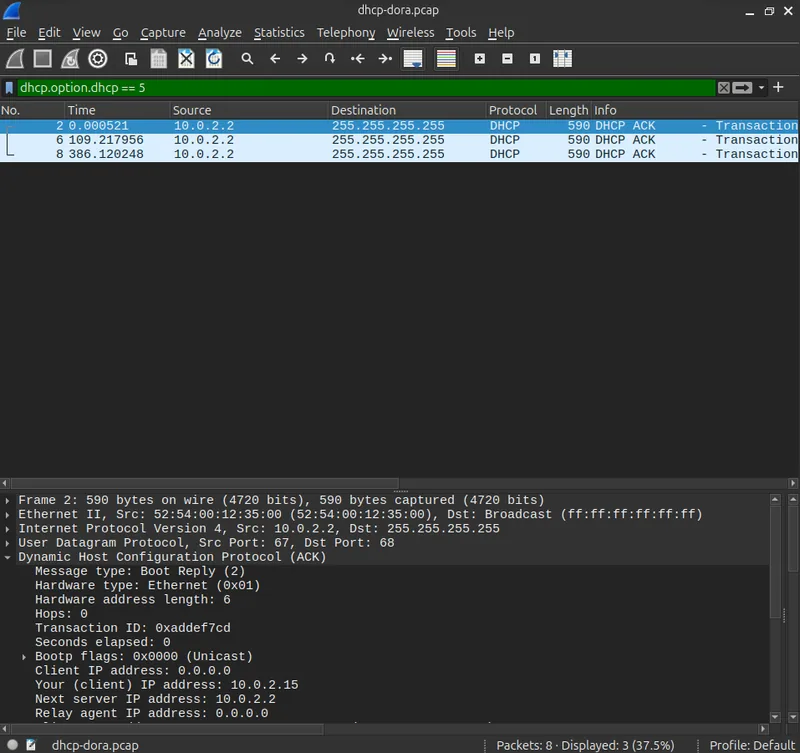
ARP and DHCP, in a real two-VM home lab. Both of these protocols share one property that ruled out doing them on a single machine: neither one is interesting until there's a second host on the other end. ARP needs a real neighbor to resolve an address for. DHCP needs a real server to negotiate a lease with. So I built the smallest possible version of that, an Ubuntu VM and a Kali VM on the same VirtualBox network, and immediately ran into the part of this project I didn't expect to be the hard part: getting the network itself working before I could capture anything on it at all.
Neither VM had an IP address. VirtualBox's Internal Network mode, it turns
out, has no DHCP server whatsoever, by design, it is just a private wire
between VMs and nothing else. Switching to a Host-only Adapter looked like the
fix until I noticed I'd only enabled that one adapter and quietly lost the
VM's separate NAT connection to the internet in the process, since each VM's
network adapters are independent settings, not layers that stack automatically.
I ended up doing what I probably should have started with: assigning static
addresses by hand on both machines, which is the actually reliable choice for
a fixed two-node lab, and only then did the ARP capture itself become the easy
part, a clean request and reply once the machines could actually see each
other. The DHCP scenario came with its own version of the same lesson: I had
to explicitly remove the static address I'd added for the ARP exercise before
dhclient could force a fresh lease negotiation, since releasing a DHCP lease
does nothing to an address you added by hand, a distinction I hadn't thought
about until the release command errored out with "address already assigned"
and I had to go figure out why.
None of that debugging shows up as its own line item in either write-up, but it's the reason both captures are genuine two-host network events instead of something I could have faked on one box, and it's honestly a better, truer-to-real-networking story than a clean capture would have been on its own.
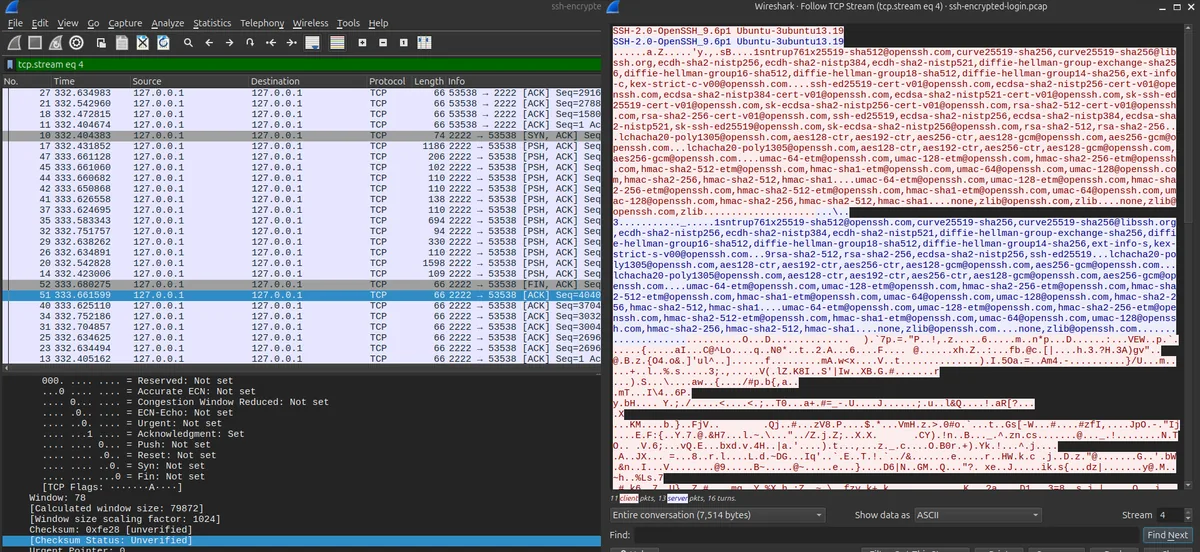
Telnet against SSH, and FTP against everything that replaced it. These two scenarios are the clearest possible argument for a rule I already knew but hadn't personally demonstrated: never manage a device or move a file over a protocol that doesn't encrypt the session. In the Telnet capture, the login prompt, username, password, and every command typed afterward are fully readable in plain text, IAC (Interpret As Command) is the single escape byte RFC 854 defines for Telnet to tell option-negotiation bytes apart from the plain session data sitting right next to them on the same stream, a design that predates any real separation between control-plane and data-plane traffic. In the matching SSH capture, using the exact same password-based authentication, the password never appears anywhere in the file at all, not encoded, not partially visible, nowhere, because a session key gets derived through key exchange before authentication ever happens. FTP tells a related but distinct story: its username and password travel as two separate plaintext commands, and worse, the protocol opens a second, completely separate TCP connection just to move the actual file data, negotiated in-band over the first connection. That two-channel design is the reason FTP has been a headache for firewalls and NAT devices for decades, and seeing the second connection actually open, live, in a capture, made that architectural quirk click in a way that reading about "active versus passive mode" never quite had.
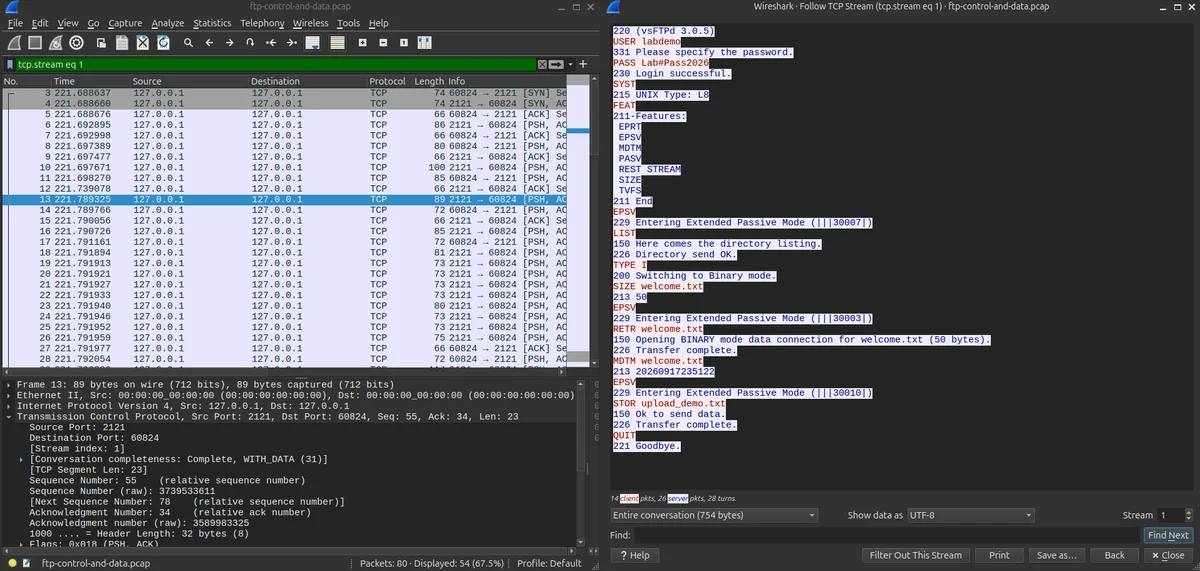
The moment that changed how I built the rest of the project
Partway through building this, I had a version of the Telnet scenario that used a small script to stand in for a real Telnet server, because the environment I built the initial version in couldn't easily run a full system Telnet daemon. It worked, technically. The bytes on the wire were genuine. But it wasn't quite the same thing as doing it for real, and once I noticed that gap, I noticed it everywhere. A handful of the screenshots in an earlier draft of this project had been generated automatically, a script quietly opening the real Wireshark application in the background and taking a real screenshot of a real capture, which is a clever enough trick that the images looked completely legitimate. They were legitimate, in the narrow sense that nothing was faked. But I hadn't taken them. I hadn't sat there and applied the filter myself, hadn't clicked Follow TCP Stream myself, hadn't had the moment of actually reading the credentials off the screen with my own eyes.
So I went back and pulled every one of those screenshots out, and rewrote the whole operational runbook around a different rule: automation is fine for standing up lab equipment, a demo web server, a test FTP daemon, a receiving process to send data to, because those are just infrastructure, the same category of thing as running any other service you'd test against. But the actual capturing, the actual filter application, the actual reading of a stream, and every screenshot, has to be something I do by hand, at least once, before any automation touches it. The scripts that used to run entire scenarios end to end are still in the project. They are just at the very end of the runbook now, framed explicitly as a shortcut for after you already understand what you're automating, not a replacement for doing it yourself the first time.
That might sound like a small distinction, but I think it's the actual difference between a portfolio project that demonstrates skill and one that just demonstrates the ability to run someone else's script. A hiring manager looking at a GitHub repo full of pcap files can't tell, from the files alone, whether the person who built it understands what's inside them. What they can tell, if they ask a single follow-up question in an interview, "why does this connection use three segments to close instead of four," or "what's actually inside that Client Hello packet you screenshot here." Being able to answer that immediately, because you generated the capture yourself and read it yourself, is the entire value of doing this work by hand instead of letting a script do it for you.
The infrastructure kept fighting back, and that turned out to be useful too
The ARP and DHCP networking detour wasn't the only place where getting the environment ready took longer than the actual capture. It was, though, the same category of lesson I ran into building the multi-VM side of an Active Directory home lab in this same VirtualBox environment: the network underneath a lab is rarely as automatic as a diagram makes it look, and the Telnet, SSH, and FTP scenarios each hid their own small, specific lesson behind a generic-looking error message, none of them obvious until I went and read the actual system log instead of guessing.
Setting up a real Telnet server through xinetd gave me a config file that
looked completely correct, and a telnet connection that was flatly refused
anyway. The fix wasn't in the config I'd written, it was in xinetd's own
startup log, which showed it had checked whether the binary I'd pointed it at
actually existed, found that it didn't at that exact path, and silently
disabled the entire Telnet service at boot rather than failing loudly about it.
Nothing about "connection refused" on its own pointed at that; only reading the
service's own log did.
The SSH half had an even less intuitive version of the same category of
problem. I added a Port 2222 line to sshd_config, restarted the service,
and the new port simply never opened, no error anywhere. It turned out that
current Ubuntu runs SSH under systemd socket activation by default: a separate
ssh.socket unit owns port 22 and only spins up sshd on demand, and an
sshd started that way listens exclusively on the socket it was handed,
completely ignoring any other Port line in its own config file. The fix was
to disable that socket unit and let sshd run the traditional way, standalone,
actually reading its own configuration, something I only found by noticing a
TriggeredBy: ssh.socket line in the service's status output that I would
have skipped right past a week earlier.
FTP's version of this was smaller but just as easy to misread: vsftpd simply
refused to start, reporting that its config file wasn't "owned by the correct
user." The file had arrived on the machine through a plain git clone, which
means it was owned by my own account, and vsftpd treats that as a security
red flag, refusing to trust a config file it can't verify belongs to root. One
chown fixed it, but only after I understood why a service would care about
file ownership at all, which is itself a small, real security lesson about how
much some daemons refuse to trust by default.
None of these three problems were protocol behavior, Telnet, SSH, and FTP all worked exactly as documented once the environment was actually correct. They were service-configuration and systemd behavior sitting one layer below the protocol I was trying to study, and every one of them was invisible until I stopped assuming "it should just work" and went and read the service's own status output instead. That habit, check what the service itself says before assuming the symptom tells the whole story, showed up constantly enough across this project that it's now just how I approach anything that fails without an obvious reason.
What this connects to
Every scenario in this project maps to a specific CCNA 200-301 exam domain, which wasn't an accident: I wanted studying for the certification and building a portfolio to reinforce each other instead of competing for the same hours. Network Fundamentals shows up in the TCP and ICMP scenarios. Network Access covers ARP. IP Services is DNS and DHCP. Security Fundamentals runs through the entire HTTP/HTTPS, Telnet/SSH, and FTP comparison work. Even Automation and Programmability gets covered, by the small Python and Bash tooling this project uses to stand up test services and, eventually, to automate the captures once they're already understood by hand, the same instinct behind a Python subnetting tool I built earlier in this series specifically so I'd stop getting VLSM math wrong by hand. IP Connectivity, the domain that would have covered the OSPF scenario I ultimately cut, is the one gap, and I'd rather say so plainly than pretend the mapping is more complete than it is.
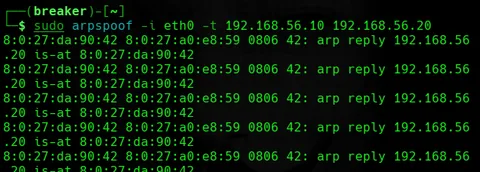
There's a security thread running through nearly every scenario too, which fits naturally alongside my cybersecurity coursework: DNS's complete lack of built-in authentication, ICMP's usefulness as a reconnaissance and diagnostic tool that also gets filtered defensively, the direct, concrete case for encryption that a plaintext-versus-encrypted comparison makes better than any slide could, and the home-lab ARP-spoofing detection exercise that connects Layer 2 attack behavior directly to a defense (Dynamic ARP Inspection) I'd otherwise only know as a name on an exam objective list. It's the same evidence-over-assertion habit behind an earlier audit I ran against my own Linux machine: run the real tool, read the real output, and say honestly what it actually showed rather than what the textbook says it should show.
The workflow that turned out to be the same every single time
Somewhere around the fifth scenario, I noticed I was doing the same nine things
every time, regardless of which protocol I was capturing. Decide exactly what
traffic I wanted to see. Start a capture with a filter narrow enough to isolate
just that traffic and nothing else sharing the interface. Generate the traffic on
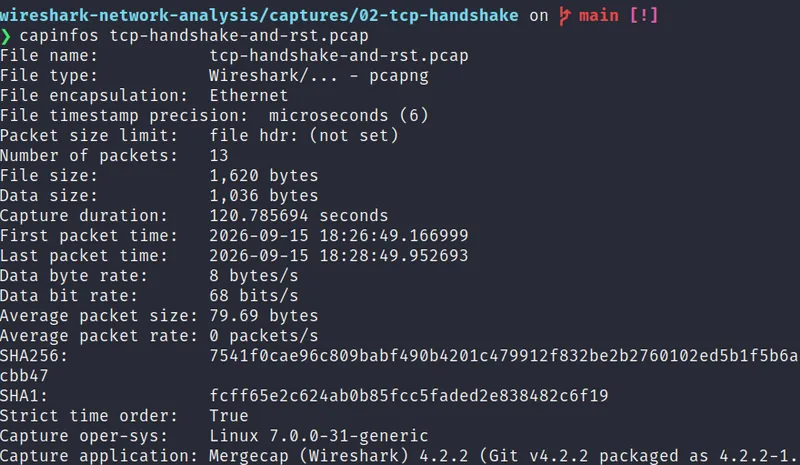
purpose. Stop the capture. Verify something actually got captured, with capinfos
or a quick tcpdump -r, before assuming the file is useless. Open it in the real
Wireshark GUI. Apply a display filter or use Follow Stream to zoom into the part
that matters. Read what's actually there and connect it back to the concept I was
trying to demonstrate. Screenshot the evidence. That loop, repeated nine times
across nine completely different protocols, is a bigger lesson than any single
scenario's protocol details: packet capture stops being an intimidating, opaque
skill the moment you realize it's the same repeatable process every time, just
pointed at a different kind of traffic. I ended up writing that workflow down
explicitly in the project's runbook, as its own short section before any of the
individual scenarios, specifically so it wouldn't stay as a pattern I only noticed
by accident.
That repetition also changed how I read a Wireshark window itself. Early on, the packet list, detail, and bytes panes felt like three separate things to learn. By the end, they felt like one instrument: the list tells you what happened and when, the detail pane tells you why, and the bytes pane is there for the rare case where you need to prove, at the rawest possible level, that something really is sitting there in plain text. Knowing which pane to reach for, without thinking about it, is the actual difference between "I've opened Wireshark before" and "I can use Wireshark to answer a specific question," and it's a difference I don't think you can get from reading about the tool. You get it from opening the same three panes a dozen times in a row until reaching for the right one stops being a decision.
Turning captures into interview answers
The other thing I didn't expect going into this project was how directly it would translate into interview preparation. A lot of technical interview advice tells you to have stories ready in the STAR format, situation, task, action, result, but most of the stories I could tell before this project were secondhand: things I'd read about, or things I understood in theory but had never personally produced evidence for. Every scenario in this project comes with a specific, defensible answer to a specific kind of interview question, because I'm not describing a protocol from memory, I'm describing a capture I generated and read myself. "Tell me about a time you diagnosed a performance issue" now has a real answer built around the packet loss scenario, complete with a specific I/O Graph shape I can describe and a specific pcap I could open on request. "Describe a time the obvious explanation turned out to be wrong" has a real answer built around the ICMP scenario, where the obvious read ("the network is down") was wrong and the actual cause ("ICMP specifically is filtered") took an actual capture to prove. Having the evidence sitting in a GitHub repo, ready to open if someone wants to see it, changes the tone of an interview answer from "I understand this concept" to "here is the thing I built to prove I understand this concept," which is a meaningfully different, and more convincing, thing to say.
What I chose to leave out, and why that's different from leaving it unfinished
All nine write-ups, the operational runbook, and the supporting documentation are finished, every capture is real, and every screenshot folder now holds actual screenshots I took myself, from my own Wireshark window, of my own traffic. That's a different statement than "twelve scenarios, nine of them done," and I want to be specific about that difference, because it was a deliberate call, not a deadline I ran out of time to hit.
VLAN trunking, OSPF, and Spanning Tree were in the original plan for this project. I didn't finish them. I cut them, once it was clear that doing them honestly meant standing up simulated switch and router infrastructure (GNS3 or Packet Tracer) that this particular lab build wasn't set up for, and I'd rather ship nine scenarios I can defend completely than twelve where three are guesswork dressed up as evidence. They're a genuinely good follow-up project once that infrastructure exists, and I mean to build it, but a project that's "waiting on a follow-up" and a project that's "quietly incomplete" are not the same thing, and I think the difference matters more in a portfolio than whether the number on the cover is nine or twelve.
If you're studying for a networking or security certification and you've noticed the same gap I did, the space between answering a question about a protocol correctly and actually being able to point at the bytes and explain them, I'd genuinely recommend building something like this for yourself rather than reading someone else's write-up of it. The value isn't in the nine pcap files sitting in a GitHub repo. It's in the nine times you sat down, typed a command you understood the reason for, fixed whatever the environment threw at you before the command would even run, watched the result appear, and had to explain to yourself why it looked the way it did. That's not something a script can do for you, and it's not something you can shortcut your way into either. You just have to do it.
Frequently asked questions
Why does this project skip VLAN trunking, OSPF, and Spanning Tree?
Those three scenarios were in the original plan, but producing genuine traffic for any of them needs simulated or real switch and router infrastructure, GNS3 or Packet Tracer, beyond what this particular lab build covers. Rather than fake the evidence with a guessed-at write-up dressed up as a real capture, they were cut outright. They're a clean follow-up project once that infrastructure exists, not a corner quietly cut, and the repository says so directly instead of padding the scenario count.
Why does the Telnet capture use a stand-in script instead of a real Telnet server?
It's a real subset of RFC 854 on the wire, genuine IAC WILL/DO option negotiation followed by a plaintext username and password prompt, because running a full system telnetd deterministically in the original build environment wasn't practical. Every byte in that capture is real and unedited. The SSH half, and the home-lab version of this same comparison described in the runbook, use a completely genuine system daemon end to end. The credential-exposure result is identical either way; only the server implementation differs.
If ping to a real host fails, does that mean the network is down?
Not necessarily. Pinging a real public resolver from this project's build environment returned a hundred percent packet loss, four requests out, nothing back at all, while DNS lookups and HTTPS requests from that same environment worked perfectly. That pattern means something on the path is silently filtering ICMP specifically, a common and deliberate network-security control, not a broken network. Recognizing that distinction, instead of escalating a false alarm, is the actual troubleshooting skill this scenario exists to teach.
What's the difference between a closed port and a filtered port?
A closed port replies immediately with a TCP RST, the host is reachable and something confirms nothing is listening there. A filtered port replies with nothing at all and simply times out, a firewall or ACL somewhere on the path silently dropped the packet, so you can't tell from the outside whether the host even exists. That distinction is the entire logic a port scanner like nmap uses to classify open, closed, and filtered, and it's why a timeout during troubleshooting is a completely different signal from an active refusal.
Where this goes from here
The full project, including the runbook, every write-up, and the real screenshots from every completed capture, is on GitHub:
Repository: github.com/rachata072/wireshark-network-analysis
This is part of an ongoing series of networking and cybersecurity projects I'm building for my portfolio while studying for the CCNA (more on my background here). More lab notes and write-ups land here as each one ships.